Stay informed with the latest insights on Mexico's economy via statistics, AI analysis, and synthesis.
Today's Lead:
Sentiment — EPU: new observations
Monetary Policy — Market Expectations: new observations
Financing — Nonfinancial Lending: new data and revisions (higher)
Financing — Volatility: data revised lower

Updated: 2026-08-02
Raymundo Peralta is recognized as the creator of the SPEI, Mexico's electronic payment system, established in 2004. The system has significantly transformed financial transactions in the country, enhancing efficiency and security. Peralta's contributions to the financial sector have been pivotal in modernizing banking operations in Mexico. — El Financiero, 01 Aug 2026. Read more
The article discusses the economic highlights of the week, focusing on Mexico's GDP and the monetary policy of the United States. It notes that President Trump and Banxico Governor Victoria Rodríguez Ceja are central figures in the current economic landscape. Additionally, it mentions Fed Chair Jerome Powell's role in shaping U.S. monetary policy during this period. — El Economista, 01 Aug 2026. Read more
Javier de la Fuente has been appointed as the new Secretary General of the National Autonomous University of Mexico (UNAM) following the resignation of Patricia Dávila. The decision was made to ensure continuity in the university's administration and to address ongoing challenges within the institution. — El Financiero, 01 Aug 2026. Read more
Kevin Warsh proposed a reduction in the frequency of the Federal Reserve's monetary policy meetings. He believes that fewer meetings could enhance the effectiveness of the Fed's communication and decision-making processes. This suggestion comes amid ongoing discussions about the Fed's approach to monetary policy under Jerome Powell's leadership. — El Economista, 31 Jul 2026. Read more
The Mexican peso strengthened against the US dollar, closing July with a gain of 1.02%. This performance reflects ongoing trends in the foreign exchange market, highlighting the peso's resilience amid various economic factors. — El Economista, 31 Jul 2026. Read more
The article discusses a significant economic performance, highlighting that it marks the best quarter in over five years. It emphasizes the positive developments in various sectors, although specific figures and detailed analyses are not provided. The report reflects optimism regarding the current economic climate. — El Financiero, 31 Jul 2026. Read more
CetesDirecto stated that investing with cash is not feasible because there would not be enough money available. The explanation highlights the limitations of cash investments in the current financial landscape. — Expansión, 29 Jul 2026. Read more
Moody's has indicated that Mexico's low economic growth is adversely affecting the banking sector. The ratings agency highlighted that the sluggish economic performance poses challenges for financial institutions in the country. This situation is expected to influence the overall stability and profitability of banks operating in Mexico. — El Financiero, 29 Jul 2026. Read more
Gabriel Cuadra highlighted that Banxico continues to confront a challenging inflation landscape. He emphasized the need for careful monitoring and appropriate policy responses to navigate the current economic conditions. The remarks reflect ongoing concerns regarding inflation management in Mexico. — El Economista, 27 Jul 2026. Read more
Mexican peso rises 1.02% in July, narrowing carry trade margin — Google News, 31 Jul 2026. Read more
Texas businesses bracing for a financial hit from U.S.-Mexico-Canada trade limbo — Google News, 31 Jul 2026. Read more
Can Mexico turn North American integration into lasting economic growth? — Google News, 31 Jul 2026. Read more
Mexico GDP: Is 1.5% Growth in 2026 a Lock? Finance Ministry Says "Unless There Are Consecutive Contractions in H2" — Google News, 31 Jul 2026. Read more
Puebla thieves make off with a million pesos from a currency exchange in a heist worthy of Netflix — Google News, 31 Jul 2026. Read more
Mexico’s GDP grew by 1.5% — Google News, 30 Jul 2026. Read more
Mexico says 1.5% GDP growth secure unless economy shrinks in second half — Google News, 30 Jul 2026. Read more
USD/MXN Forecast: How Long Does the Peso’s Carry Trade Have Left to Run? — Google News, 30 Jul 2026. Read more
Mexico’s GDP Grows 2.1% in 2Q26; State Street Makes Market Entry — Google News, 30 Jul 2026. Read more
Fitch Keeps Mexico at BBB-, Cites PEMEX, Growth Risks — Google News, 30 Jul 2026. Read more
Updated: 2026-07-31 by Alexander Dentler

Key Takeaways
Following the May 7, 2026 decision, Banxico's policy rate stands at 6.50%, reflecting a hold from its previous cut. After Banxico's May 7 meeting, the target rate remains at 6.50%, following a cumulative reduction of 0.25% in recent months. The current streak of no change suggests a period of assessment, particularly as inflation trends and economic conditions evolve. This decision aligns with broader market expectations, which are now favoring a potential rate cut in the upcoming meeting due to easing headline inflation pressures.
Relative to the United States, the Fed's target rate currently sits at 3.62%, creating a significant differential of 2.88%. The Fed's target rate remains at 3.62%, reflecting its own recent cut of 0.25%. This substantial rate differential between Banxico and the Fed underscores the potential for capital flows to favor the higher-yielding Mexican assets, especially should Banxico decide to cut rates as anticipated by market participants. The first-mover dynamics observed in the past, with the Fed often leading, may influence Banxico's upcoming decisions.
The rate differential poses implications for capital flows and foreign exchange dynamics, particularly amid rising economic policy uncertainty. The rate differential is likely to attract foreign investment, but it also places pressure on the peso as market participants assess the balance between immediate monetary easing and long-term structural challenges. For markets, this creates a dual narrative: one of short-term relief versus long-term stability, ultimately influencing investment strategies and currency dynamics.
The central bank's policy rate is the primary tool for steering inflation and economic activity. Banxico targets 3% annual inflation and adjusts its overnight interbank rate to influence borrowing costs throughout the economy. The rate differential with the United States affects capital flows and exchange rate dynamics — a wider spread can attract foreign investment but may constrain domestic credit. Policy decisions are announced roughly every six weeks following scheduled monetary policy meetings.
Updated: 2026-07-10 by María López
Key Takeaways
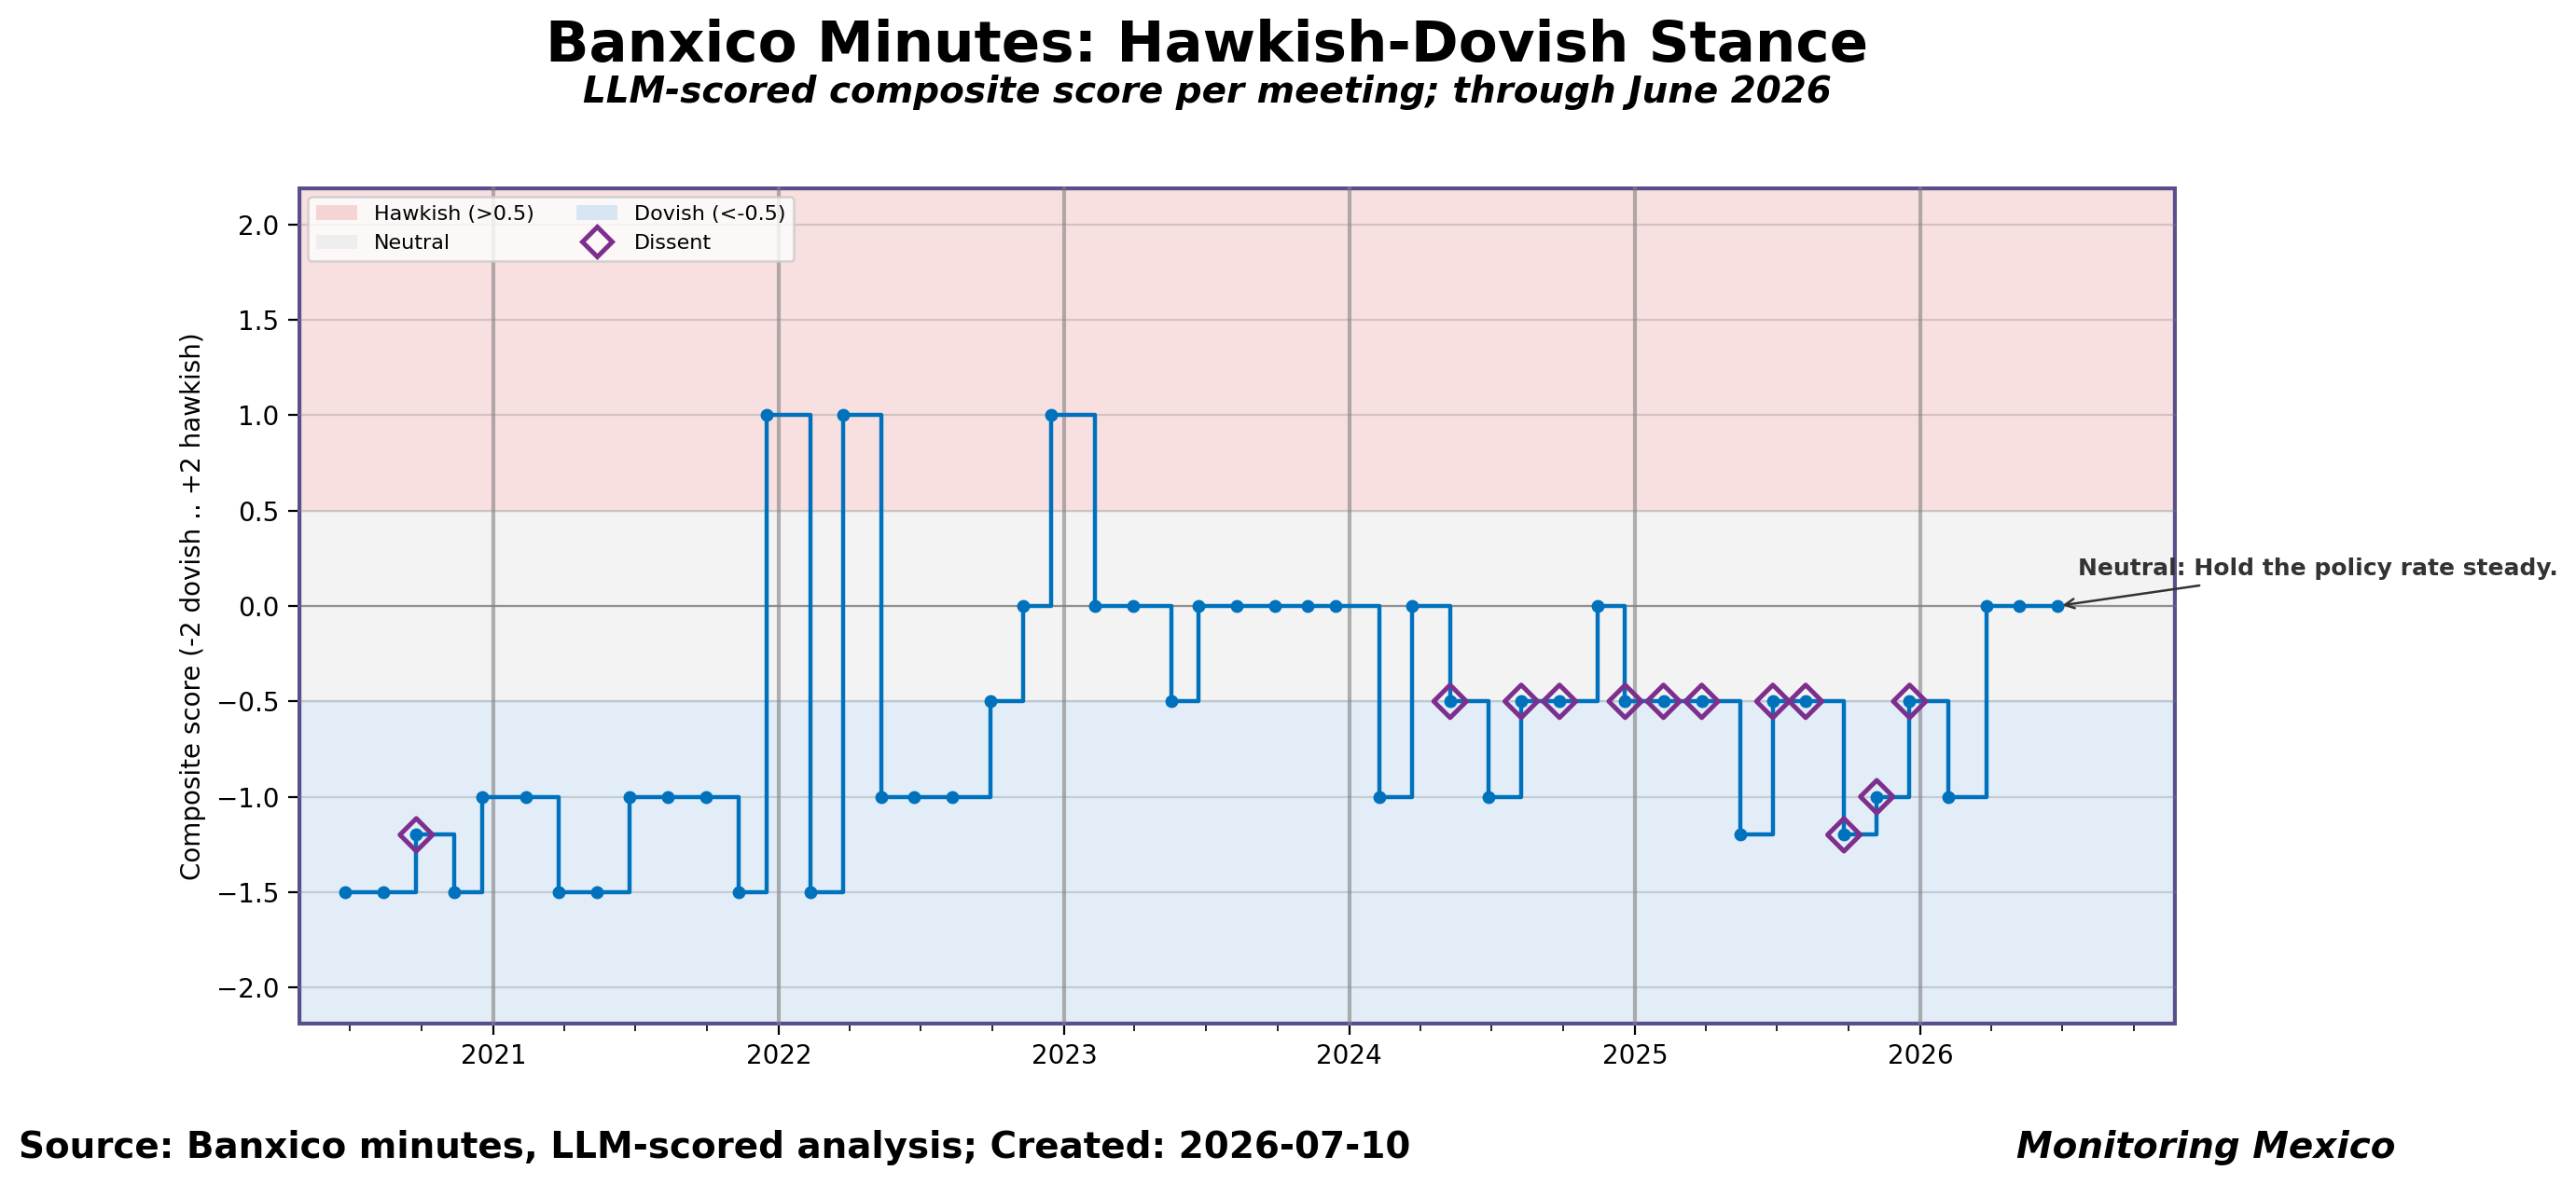
Banxico's minutes from the June 25 meeting show a neutral tone (composite score +0.0). Banxico's minutes from the June 25 meeting show a neutral tone (composite score +0.0). The committee's decision: Hold the policy rate steady.. Vote split: 5 hold.
The committee emphasizes the commitment to price stability. Forward guidance: The committee emphasizes the commitment to price stability. Future policy will be data-dependent, with a focus on inflation dynamics and external risks. Hawkish signals: Global inflation continues to rise due to energy prices.; Inflation expectations for the end of 2026 have been revised upwards in various countries.. Dovish signals: Recent negotiations have eased concerns about energy supply.; The US labor market risks have decreased, with stable job creation..
The tone is more hawkish compared with the prior 3 meetings. The tone is more hawkish compared with the prior 3 meetings. The latest composite score of +0.0 compares with a -0.3 average over the previous 3 meetings. The vote was unanimous, with no recorded dissent.
Each Banxico monetary policy meeting's published minutes are analyzed by a large language model, which scores the committee's overall tone on a composite scale from -2 (very dovish) to +2 (very hawkish) and extracts the vote split, forward guidance, and hawkish/dovish signals. Minutes are typically published by Banxico about two weeks after the corresponding policy decision, so this analysis always lags the live decision by that margin. The commentary on this page is assembled directly from those stored, structured fields rather than generated by a separate LLM call.
Updated: 2026-08-02 by María López

Key Takeaways
With the latest CPI data and shifting economic policy uncertainty on the table, our model-based expectations are signaling a tight decision ahead for Banxico. The current landscape indicates about a 58% probability of no action at the next meeting on February 5, 2026, reflecting a substantial chance of inaction amidst rising global inflation concerns. Meanwhile, the mean expected move hovers around -11bp, a material shift from previous assessments. The modal bucket sits at ±0bp, with a notable 38.9% leaning towards a -25bp cut as well. This presents a complex picture for policymakers, caught between immediate economic pressures and long-term inflationary risks.
Recent updates in our driver data reveal a mixed bag, influencing the outlook. Inflation has ticked lower, while economic policy uncertainty remains pronounced, complicating the decision-making environment. These updates are crucial as they shape the committee's considerations around potential rate adjustments.
Diving into the drivers, the influence on policy is nuanced and multifaceted. Moderate dovish pressure emanates from easing inflation, but rising global energy prices continue to exert a negative influence, heightening inflationary concerns. Economic policy uncertainty is a significant factor, reflecting the overarching anxiety in markets. Notably, the peso's stabilization has had a negligible impact on the decision drivers. Ultimately, the committee’s judgment will weigh these factors heavily as they navigate their path forward.
Ordered Probit Probabilities
| Rate Change | 04 Feb | 05 Feb 2026 | Δ |
|---|---|---|---|
| Cut | 58.4% | 42.0% | -16.4 |
| Hold | 41.6% | 58.0% | +16.4 |
| Hike | 0.0% | 0.0% | +0.0 |
| E[Δrate] | -17.5 bp | -11.3 bp | +6.2 bp |
Probabilities in %. Modal bin in bold. E[Δrate] = probability-weighted expected change in basis points.
When markets and the public can anticipate how and why the central bank acts, uncertainty falls and policy becomes more effective. Clear communication helps businesses plan investments, households make borrowing decisions, and international investors gauge currency risks. Economists often stress the importance of clarity and traceability — the ability to follow and understand decisions step by step. Without it, rate moves risk being misread, causing volatility instead of stability. With it, policy signals are more credible, anchoring expectations and strengthening the central bank's influence.
Rate-change probabilities are estimated using an ordered probit model with eight macroeconomic and financial drivers: consumer price inflation (CPI), consumer confidence, the 30-day peso/dollar change, the CETES 28-day spread, stock market growth, the yield curve slope (10Y minus 2Y), Mexico's Economic Policy Uncertainty index, and the Fed-Banxico rate differential. The model maps these drivers into probability bins for the next monetary policy decision, ranging from cuts of 50 basis points or more to hikes of the same magnitude. Coefficients are estimated on the historical record of Banxico decisions and their pre-decision data environment. Probabilities update daily as driver series refresh and should be treated as one input among many.
Out-of-sample backtest across 24 past meetings: the modal prediction matched the actual decision 46% of the time, directional accuracy (hike/hold/cut) was 67%, Brier score 0.720. Out-of-sample backtest across 24 past meetings: the modal prediction matched the actual decision 46% of the time, directional accuracy (hike/hold/cut) was 67%, Brier score 0.720. Lower Brier scores indicate better-calibrated probability forecasts.
Updated: 2026-07-27 by Ignacio Crane
Key Takeaways
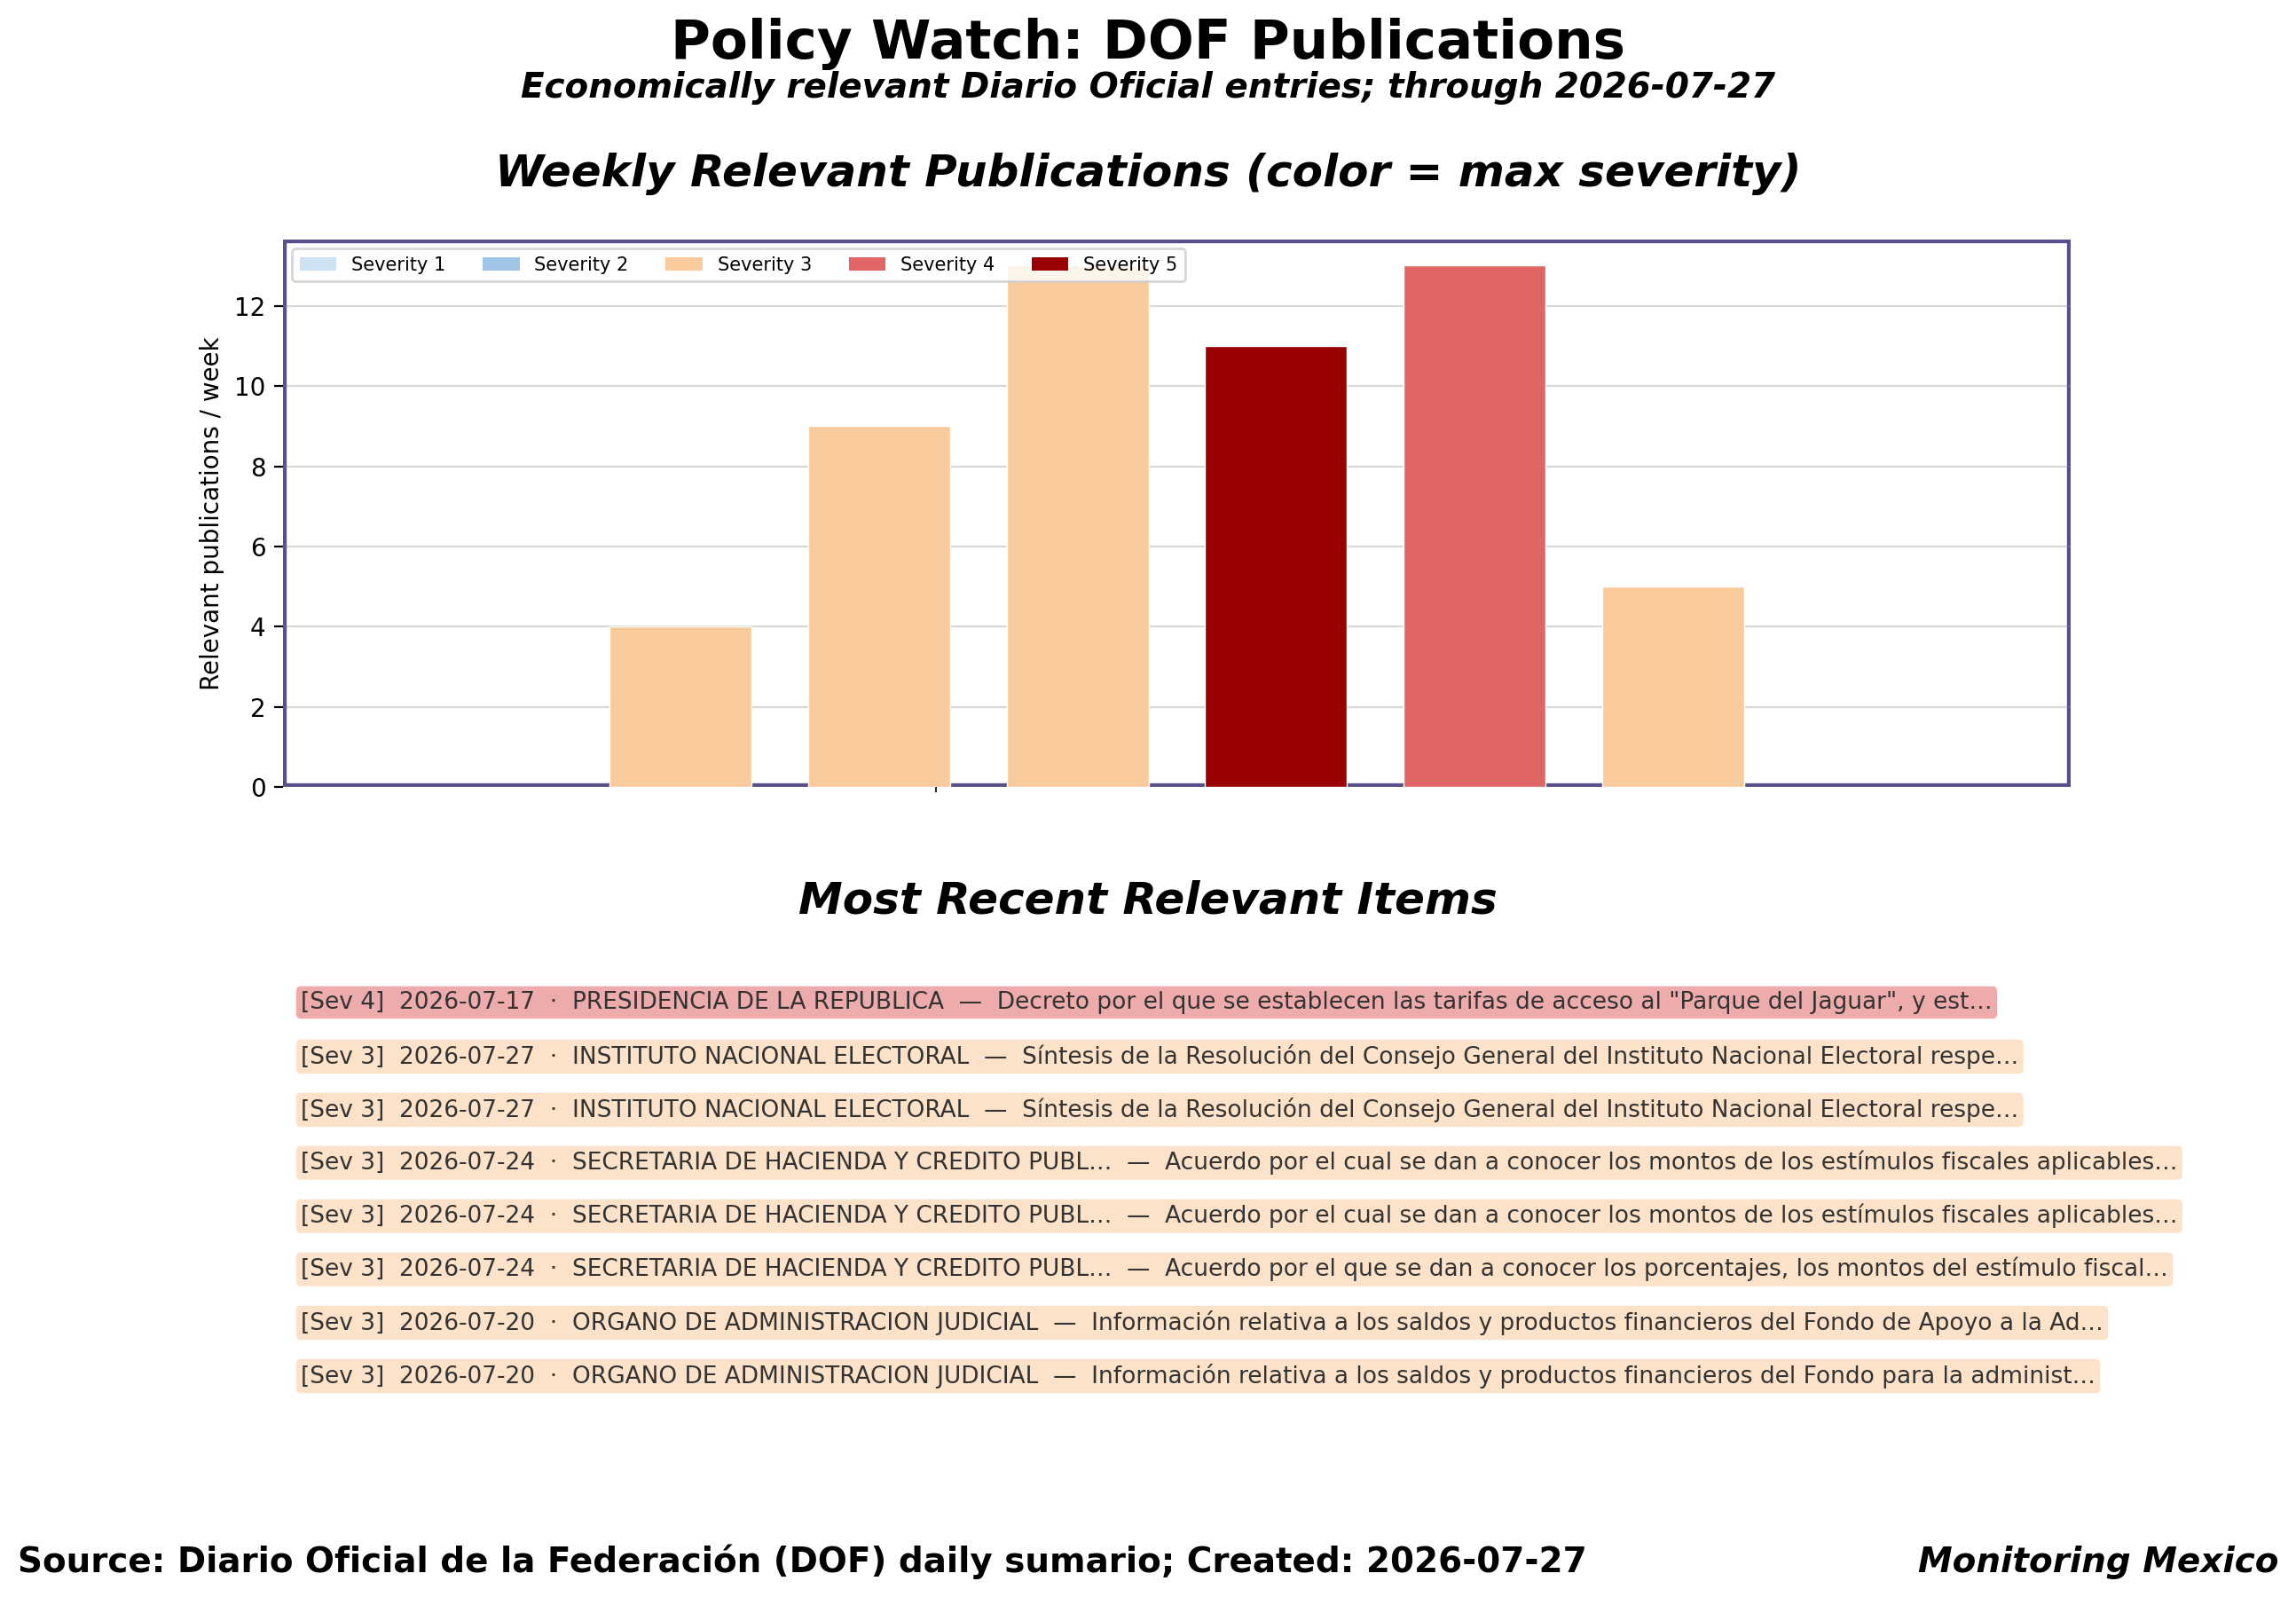
The DOF carried 5 economically relevant publications in the week ending July 27, 2026. The DOF carried 5 economically relevant publications in the week ending July 27, 2026. By category: tax (4), trade (2), energy (1), judicial (1). The weekly maximum severity reached 3/5.
Recent notable publications include:. July 17 — PRESIDENCIA DE LA REPUBLICA: Decreto por el que se establecen las tarifas de acceso al "Parque del Jaguar", y estímulos fiscales al pago de derechos de las Áreas Natura… (severity 4/5). July 27 — INSTITUTO NACIONAL ELECTORAL: Síntesis de la Resolución del Consejo General del Instituto Nacional Electoral respecto de las irregularidades encontradas en el dictamen c… (severity 3/5). July 27 — INSTITUTO NACIONAL ELECTORAL: Síntesis de la Resolución del Consejo General del Instituto Nacional Electoral respecto de las irregularidades encontradas derivado de la a… (severity 3/5).
CONAMER (the Comisión Nacional de Mejora Regulatoria), which previously required draft regulations to be pre-published for public consultation before taking effect, was extinguished by a reform enacted in June 2025. With that pre-publication consultation step gone, the Diario Oficial de la Federación is now the earliest official signal available for new regulations, decrees, and reforms — there is no longer an upstream draft-stage checkpoint to monitor instead.
This monitor scans the DOF's daily sumario (official gazette summary) for publication titles and issuing organisms, then applies a keyword classifier — not an LLM — to flag economically relevant entries across six categories (tax, trade, labor, energy, financial regulation, judicial) and assign a severity score from 1 (routine) to 5 (major fiscal/labor policy change, e.g. Miscelánea Fiscal or a minimum-wage decree). Only sumario titles and issuing organisms are scanned in this MVP; full document text is not retrieved or analyzed.
So…what is this—and why am I doing it?
This project began with a simple question in 2021: how much of the work of producing useful economic information can we hand over to machines? Monitoring Monetary Policy in Mexico is a thought experiment at that frontier. By combining statistical analysis, tailored visualizations, and large language models, it demonstrates how even highly specialized topics—such as Mexican monetary policy—can be made more accessible, relevant, and insightful. Meanwhile, the system is designed to run without human intervention on a daily basis. My role is to set the design; the automation carries it out.
When does data stop being a dump and start being a story?
The initiative builds on my earlier Monitoring Mexico project but has since evolved in important ways. Data is no longer simply displayed; it is analyzed, distilled, forecasted, visualized, interpreted, narrated, and contextualized. Large language models help transform both raw and modeled data into context, turning numbers into stories. In short, raw information is transformed into understanding.
Who’s in charge here—a Raspberry Pi or common sense?
Behind the scenes, the site runs on a Raspberry Pi 5 powered by Python and a library of custom routines. Automation drives much of the process, but human expertise remains essential in designing the explanation and presenting the material. The balance between machine efficiency and human judgment is what makes the project work.
How do we cut through the jargon and keep the signal?
The aim is straightforward: to bring clarity to an area often obscured by technical detail. Monetary policy shapes households, firms, and markets, yet its analysis usually remains confined to experts. By filtering, explaining, and visualizing the data, this project seeks to make that knowledge more transparent and more useful.
Is this the 80/20 rule you learn in business school in the wild?
At its core, the site is both a contribution to public understanding and an exploration of how informational value is created. It is a humble attempt to deliver 80% of the insights of a central bank analysis with 20% of the resources—while also testing what the future of knowledge generation might look like.
What might be new the next time you drop by?
This is very much a work in progress, with new features, analyses, and visualizations added over time. We can now at the brink of generating our very own economic policy uncertainty (EPU) index, and we consider a newsletter. But maybe a chatbot might be more appropriate? Coming back to check for updates is always a good idea. If the site sparks curiosity, fosters dialogue, or simply helps illuminate Mexico’s economic dynamics, it has achieved its goal.
Updated: 2026-07-31 by Alexander Dentler

Key Takeaways
The mid-July 2026 CPI release shows headline inflation at 3.36%, comfortably within Banxico's 2%-4% target band. The mid-July 2026 CPI release shows headline inflation at 3.36%, placing it around the 21st percentile of historical data and within Banxico's 2%-4% target band. This reflects a modest increase of 0.03% compared to the previous month. The current rate highlights a stabilizing trend in consumer prices, which is critical for maintaining market confidence and guiding monetary policy decisions.
Core inflation, which excludes the more volatile food and energy components, stands at 4.07%, indicating sustained underlying inflationary pressures. Core inflation, which excludes the more volatile components of food and energy, is currently at 4.07%. This figure is notably higher than the headline rate, suggesting that while overall price pressures may be easing, underlying inflation remains robust. The recent increase of 0.03% in core inflation signifies a divergence from Banxico's target, emphasizing the need for a careful evaluation of monetary policy as we navigate the complexities of inflation dynamics.
Trade prices reflect a nuanced landscape, with export prices experiencing a notable downward trend. Import and export price indices reveal compelling trends, with export prices showing a current growth rate of 12.84%, albeit on a declining trajectory over the past three months. This shift underscores the external pressures facing the economy, as import prices also remain elevated at 5.43%. The interplay between these trade price movements and domestic inflation highlights the interconnectedness of global market conditions and local economic stability, which policymakers must consider when formulating future strategies.
| 1H Jul 2026 | 1H Jul 2027 | |||||
|---|---|---|---|---|---|---|
| Series | Current | Prev. Fcast | Error | 12M Fcast | Prev. 12M | Rev. |
| Headline CPI | 3.4 | — | — | 4.7 | 4.7 | +0.00 |
| Core CPI | 4.1 | — | — | 4.4 | 4.4 | +0.00 |
| Export Price Index | — | — | — | 5.7 | 5.7 | +0.00 |
| Import Price Index | — | — | — | 4.9 | 4.9 | +0.00 |
All values in percentage points (YoY, seasonally adjusted). "Error" = actual minus previous forecast. "Revision" = change in 12-month outlook since last update. "—" = no prior forecast available.
The Consumer Price Index (CPI) measures changes in the cost of a representative basket of goods and services purchased by Mexican households. Banxico targets 3% annual inflation with a tolerance band of 2%-4%. Core CPI — which excludes volatile food and energy prices — reveals underlying inflation trends that guide monetary policy. Import and export price indices extend the picture by linking Mexico's inflation dynamics to global markets, trade flows, and currency movements.
Headline CPI, core CPI, export prices, and import prices are projected six months ahead using a Vector Autoregression (VAR). The four series are estimated jointly, so each informs the others' forecasts through lagged interactions. Projections update each time new CPI data arrive and may shift materially after revisions.
Out-of-sample backtest over 72 evaluation windows using the Vector Autoregression (VAR). Out-of-sample backtest over 72 evaluation windows using the Vector Autoregression (VAR). RMSE measures the typical forecast error in the same units as the series; 'naive' is a no-change benchmark. Headline CPI (RMSE 1.07 vs 1.02 naive, n=72); Core CPI (RMSE 0.64 vs 1.05 naive, +39% improvement, n=72); Export Price Inflation (RMSE 7.27 vs 7.77 naive, +6% improvement, n=56); Import Price Inflation (RMSE 2.99 vs 2.05 naive, n=56).
Updated: 2026-06-26 by Alexander Dentler
Key Takeaways
The recent update from the SHF House Price Index reveals significant insights into the state of the housing market, particularly with the new observation of 8.71% YoY inflation as of 2026-01-01. This level of house price inflation exceeds historical averages, positioning itself in the 75th percentile since 2006. In comparison, headline CPI inflation stands at 3.94% while housing CPI inflation is at 3.61%, suggesting that house prices are rising notably faster than general inflation metrics. This divergence reflects the ongoing demand pressures in the housing sector, despite a slight decline of 0.21 percentage points from the previous quarter.
The DFM nowcast provides valuable context, estimating house price inflation at 8.65% YoY as of 2026-05-01. This nowcast aligns closely with the latest observed value, indicating that auxiliary indicators such as mortgage lending and housing CPI are confirming the current trajectory rather than suggesting any significant upward or downward pressure. The model's consistency with observed data suggests that the dynamics within the housing market remain robust and supportive of sustained inflationary trends.
DFM Nowcast Comparison
| Observed | Nowcast | Prev. Nowcast | Gap | Revision | |
|---|---|---|---|---|---|
| SHF House Price Inflation (YoY) | 8.71% | 8.65% | 8.65% | -0.06 | +0.00 |
Observed: 2026-Q1. Nowcast: 2026-05. Previous nowcast: 2026-05. "Gap" = nowcast − observed. "Revision" = change in nowcast since previous run.
The SHF House Price Index is published quarterly by Sociedad Hipotecaria Federal, Mexico's federal mortgage development bank, typically around 40 days after the reference quarter ends. It is constructed from mortgage appraisal data (avalúos) using a Case-Shiller repeat-sales methodology, with breakdowns by state, new vs. used housing, and market segment (affordable vs. mid-to-high-end). Because the index reflects prices at the point of mortgage origination, it captures credit-driven demand rather than asking prices, making it a tighter gauge of actual transaction values and collateral quality across the housing market.
A Dynamic Factor Model (DFM) filters the quarterly SHF House Price Index using five Banxico auxiliary series — the funding rate, mortgage lending volumes, a housing purchase survey indicator, the SPF unemployment forecast, and construction activity — plus two CPI components (headline and housing subcategory). The model extracts a common factor from these seven indicators, producing a smoothed nowcast that updates between quarterly SHF releases whenever auxiliary data arrive. This filtered estimate helps distinguish persistent trends from quarterly noise in the observed house price series.
Out-of-sample backtest over 12 evaluation windows using the Dynamic Factor Model (DFM). Out-of-sample backtest over 12 evaluation windows using the Dynamic Factor Model (DFM). RMSE measures the typical forecast error in the same units as the series; 'naive' is a no-change benchmark. House Price Nowcast (RMSE 1.32 vs 0.66 naive, n=12).
Updated: 2026-06-06 by María López
Key Takeaways
Brent oil prices just jumped to $106.30 as of May 2026, reflecting a staggering YoY increase of 65.8%. Brent oil prices through May 2026 show a notable rise, landing at $106.30. This marks a significant YoY change of +65.8%, and the momentum is clearly up, with prices climbing in recent days. For Mexico, where oil is a major export and accounts for about 15% of federal revenue, these figures are crucial — they could bolster government finances and Pemex operations.
Copper prices are hitting $13,483.75, up 41.5% YoY as of May 2026. With copper data updated to May 2026, the current price stands at $13,483.75, showcasing a robust YoY increase of 41.5%. The trend remains upward, indicating strong demand in the global market. Given that Sonora dominates copper production in Mexico, this surge could enhance regional economic activity, despite the sector's small employment footprint.
Corn prices are at $215.62, reflecting a modest YoY increase of 5.3%. As of May 2026, corn prices reached $215.62, showing a slight YoY rise of 5.3%. The trend appears stable, neither soaring nor plummeting significantly. This is particularly relevant for Mexico, where corn is a staple for many, and price stability is key for the 1.5 million smallholder farmers dependent on this crop.
Commodity prices feed directly into Mexico's inflation pulse and terms of trade. Oil and corn affect energy and food costs, while copper is a proxy for global industrial demand. For policymakers, sharp commodity swings can shift inflation expectations and fiscal balances, making these prices critical to monitor.
Updated: 2026-07-25 by Pablo Rivas

Key Takeaways
The May 2026 IMSS release shows unit labor costs at -3.41%, indicating productivity gains outpacing wage growth. Following May's formal sector wage data, ULC has fallen, sitting at the 19th percentile with a month-over-month increase of 1.18. This decline suggests that productivity is growing faster than wages, which could enhance competitiveness but may also hint at potential wage suppression in the manufacturing sector. Employers are gaining an edge, but this trend could be a double-edged sword for workers as their earnings lag behind productivity improvements.
Real wages in the formal sector reflect a concerning trend, with manufacturing experiencing negative growth. Currently, real wages in manufacturing are at -2.59%, signifying a decline in purchasing power for households dependent on this sector. As the cost of living continues to rise, households are feeling the pinch, which could dampen consumer spending and overall economic sentiment. Meanwhile, the retail sector paints a different picture, with real wages up at 6.03%, providing a breath of fresh air for those involved in retail work.
Across sectors, a stark divergence emerges, particularly in real wage growth. While retail workers enjoy a robust uptick in real wages, manufacturing lags significantly behind, underscoring the varying economic realities faced by workers in these sectors. The contrasting performance highlights the resilience of the retail sector amid broader economic challenges, while manufacturing workers are still grappling with wage stagnation. This divergence could influence labor dynamics and spending patterns, impacting overall economic recovery.
SARIMAX Forecast Comparison
| Series | Current | Prev. Forecast | Error | 12M Forecast | Prev. 12M | Revision |
|---|---|---|---|---|---|---|
| ULC Manufacturing | — | — | — | -4.1 | -4.1 | +0.00 |
| ULC Retail | — | — | — | 1.4 | 1.4 | +0.00 |
| Real Wage Mfg | — | — | — | -2.4 | -2.4 | +0.00 |
| Real Wage Retail | — | — | — | 5.8 | 5.8 | +0.00 |
All values in % (MoM, seasonally adjusted). "Error" = actual − previous forecast. "Revision" = change in 12-month outlook. "—" = no prior forecast available.
Unit labor costs (ULC) measure the average cost of labor per unit of output — when wages grow faster than productivity, ULC rises, potentially squeezing profit margins and fueling inflation. In Mexico, where the formal sector employs roughly half the workforce, IMSS-registered wage data captures trends in the formal economy but misses the informal sector's dynamics. Real wages — nominal wages adjusted for inflation — determine household purchasing power and underpin consumer demand. For policymakers, these indicators help balance inflation control, competitiveness, and the economic welfare of Mexican workers.
Twelve-month-ahead forecasts for unit labor costs and real wages in manufacturing and retail are produced using a Seasonal Autoregressive Integrated Moving Average with eXogenous inputs (SARIMAX) model. The model is estimated on seasonally adjusted month-over-month percentage changes, with all four series — ULC manufacturing, ULC retail, real wage manufacturing, and real wage retail — entering as joint endogenous variables. No external auxiliary data feed the forecast; the model relies solely on the internal dynamics and cross-series interactions of the wage and productivity data. Forecast confidence intervals widen over the projection horizon.
Out-of-sample backtest over 24 evaluation windows using the SARIMAX. Out-of-sample backtest over 24 evaluation windows using the SARIMAX. RMSE measures the typical forecast error in the same units as the series; 'naive' is a no-change benchmark. ULC Manufacturing (RMSE 2.97 vs 3.21 naive, +7% improvement, n=24); ULC Retail (RMSE 5.33 vs 5.22 naive, n=23); Real Wage Manufacturing (RMSE 2.20 vs 2.62 naive, +16% improvement, n=24); Real Wage Retail (RMSE 3.05 vs 2.97 naive, n=23).
Updated: 2026-06-19 by Pablo Rivas

Key Takeaways
Following the recent updates in key economic indicators, real GDP growth in Mexico is now estimated at 4.96%, reflecting a robust upward revision of 2.66%. The latest quarterly GDP release from INEGI shows a marked increase in growth expectations, signaling a healthier economic outlook. This adjustment highlights a strong recovery trajectory, likely driven by resilient domestic consumption and improved industrial performance. As we advance into Q1 2026, this optimistic figure may bolster confidence among investors and policymakers alike.
Private consumption continues to be a key driver of growth. Household spending is estimated to have soared to 8.09%, significantly outpacing GDP growth. This robust expansion suggests that consumers are confident and willing to spend, providing essential support to overall economic activity. Such vigor in private consumption is a positive sign, signaling a thriving domestic market that can help buffer against external shocks.
Exports are struggling to keep up with domestic demand. External demand remains tepid, with export growth now at a mere 0.58%. This lackluster performance raises concerns about Mexico's competitiveness in the global market, especially as trading partners navigate their own economic uncertainties. The soft export figures could hint at challenges ahead for sectors reliant on international trade, potentially dampening the overall growth outlook.
Imports are indicating a shift in domestic absorption patterns. Imports have contracted to 1.56%, reflecting a 3.81% decline from previous estimates. This downturn signals a potential cooling in domestic demand, as consumers and businesses may be becoming more cautious in their spending habits. The drop in imports could also suggest that the economy is adjusting to current market conditions, though it may raise questions about future growth sustainability.
Net trade dynamics appear to be shifting. The trade balance contribution remains a mixed bag, as the decline in imports coupled with stagnant export growth presents a complex scenario. While fewer imports can ease some pressure on the trade deficit, the sluggish export performance raises flags about Mexico's economic resilience in a challenging global landscape. Policymakers will need to monitor these trends closely to ensure balanced and sustainable growth.
DFM GDP Nowcasts
| Component | Last Obs. (Q1 2026) | Nowcast (Q1 2026) | Prev. Nowcast | Revision |
|---|---|---|---|---|
| Real Gross Domestic Product | 6.19% | 4.96% | 4.96% | +0.00 |
| Private Consumption | 0.15% | 8.09% | 8.09% | +0.00 |
| Imports | 25.37% | 1.56% | 1.56% | +0.00 |
| Exports | 0.58% | 0.58% | 0.58% | +0.00 |
QoQ annualized, seasonally adjusted. Nowcast = DFM filtered estimate using higher-frequency inputs. "Revision" = change from previous run.
Real activity data tracks the economy's engine — output, spending, and trade — while nowcasts bridge the lag between releases. Real GDP captures total production; private consumption reflects household demand; exports and imports reveal external demand and the flow of inputs for Mexico's trade-exposed, manufacturing-heavy economy. Shifts in U.S. demand, global prices, and the peso often show up first in trade, then filter into GDP and consumption. Because official series arrive with delays and revisions, model-based nowcasts provide an early, probabilistic read for policy timing — useful if treated with uncertainty bands and cross-checked against higher-frequency signals.
A Dynamic Factor Model (DFM) nowcasts quarterly GDP and its demand components — private consumption, imports, and exports — using 14 higher-frequency inputs. These include monthly employment indicators, industrial production (IGAE), consumer confidence, capacity utilization, retail sales, and private consumption, plus quarterly GDP sector breakdowns. The model extracts common factors via the Kalman filter, updating the nowcast each time any input series receives new data. Nowcast estimates are conditional expectations that narrow as more data arrive within each quarter.
Out-of-sample backtest over 12 evaluation windows using the Dynamic Factor Model (DFM). Out-of-sample backtest over 12 evaluation windows using the Dynamic Factor Model (DFM). RMSE measures the typical forecast error in the same units as the series; 'naive' is a no-change benchmark. Real GDP (RMSE 3.90 vs 3.82 naive, n=12); Private Consumption (RMSE 5.41 vs 2.51 naive, n=12); Exports (RMSE 22.26 vs 18.28 naive, n=12); Imports (RMSE 11.34 vs 17.09 naive, +34% improvement, n=12).
Updated: 2026-07-25 by Pablo Rivas

Key Takeaways
The latest ENOE survey for May 2026 shows unemployment at 3.43%, reflecting a continued downward trend that has persisted for over four years. The May 2026 ENOE survey shows unemployment at 3.43%, around the 1st percentile historically and marking a decrease of 0.01% from April. This downward trajectory has been consistent, with the rate now on a 58-month streak of declines. The implications are clear: while the labor market appears to be tightening, ongoing structural challenges remain, particularly in relation to economic policy uncertainty.
By gender, male unemployment sits at 3.31%, while female unemployment is slightly higher at 3.48%. Male and female unemployment rates registered at 3.31% and 3.48%, respectively, indicating a modest divergence with women's unemployment slightly outpacing men's. Despite both rates trending downward, the persistence of this gap suggests different labor market dynamics at play, possibly influenced by sectoral employment differences and varying access to opportunities.
The share of informal workers in the economy has risen, now standing at 55.7%, which is concerning given its high percentile ranking. Informal employment has increased to 55.7%, reflecting a rise that points to economic insecurity as workers may be turning to less stable job arrangements. This trend signals potential weaknesses in the formal labor market, and a growing reliance on informal sectors could complicate efforts to improve overall economic stability.
DFM Employment Nowcasts
| Indicator | Last Obs. (Q2 2026) | Nowcast (Q2 2026) | Prev. Nowcast | Revision |
|---|---|---|---|---|
| Unemployment Rate | 2.75% | 3.43% | — | — |
| Underemployment Rate | 10.28% | 12.12% | — | — |
| Male Unemployment | 2.45% | 3.31% | — | — |
| Female Unemployment | 2.71% | 3.48% | — | — |
Observed = latest quarterly ENOE value. Nowcast = DFM filtered estimate using monthly auxiliary data. "Revision" = change from previous run.
Labor slack and its composition shape inflation pressure, policy timing, and social risk. Unemployment, underemployment, and unemployment by gender reveal how broad and uneven slack is. In Mexico's large informal sector, the informal employment share can swing sharply — often contracting faster in downturns as unprotected jobs are cut first, then rebounding early — masking true slack if headline unemployment alone is tracked. Tracking these dimensions helps distinguish cyclical slack from structural mismatches and calibrate monetary policy accordingly.
Between quarterly ENOE survey releases, a Dynamic Factor Model (DFM) nowcasts employment indicators using higher-frequency auxiliary data. The model ingests monthly series — industrial production, consumer confidence, capacity utilization, retail sales, and private consumption — alongside quarterly GDP components to extract common factors that track the business cycle. When any auxiliary series receives new data, the Kalman filter updates the nowcast, providing an early signal before the next official employment release.
Out-of-sample backtest over 20 evaluation windows using the Dynamic Factor Model (DFM). Out-of-sample backtest over 20 evaluation windows using the Dynamic Factor Model (DFM). RMSE measures the typical forecast error in the same units as the series; 'naive' is a no-change benchmark. Unemployment (RMSE 22.27 vs 0.13 naive, n=17); Underemployment (RMSE 1.26 vs 0.50 naive, n=11); Male Unemployment (RMSE 0.44 vs 0.26 naive, n=11); Female Unemployment (RMSE 0.44 vs 0.28 naive, n=11).
Updated: 2026-07-11 by María López
Key Takeaways
INEGI's Q2 2026 productivity release shows secondary sector output at 102, reflecting a slight decline of -0.79% from the previous month, but a modest increase of 0.313% from six months ago. Despite the recent dip, the aggregate index remains in the 81st percentile historically, suggesting robust underlying strength. This performance is largely driven by manufacturing, which continues to dominate the secondary sector with a hefty 66.57% share. While construction also holds up well at a healthy 85th percentile, mining is lagging significantly, underscoring a lack of broad-based growth across all subsectors.
Across the PCA indices, manufacturing composites show a concerning divergence between productivity and labor demand metrics. Productivity has slipped by -0.223%, while sales increased slightly by 0.0281%, indicating a potential buildup of inventory pressure. This misalignment raises sustainability concerns as firms may face challenges in maintaining output levels amid rising costs and declining demand for labor.
Within manufacturing, the top-performing subsectors include transport equipment and food, both showcasing resilience amid overall sector fluctuations. Transport equipment experienced a notable rise of 2.99%, while the food subsector remains strong at the 84th percentile. In contrast, the petroleum and coal products sector is struggling, with a significant decline of -10.5%, which reflects broader issues in energy pricing affecting manufacturing dynamics.
PCA Composite Indices
| Index | May 2025 | Jun 2025 | Δ |
|---|---|---|---|
| Productivity Index | 0.50 | 0.28 | -0.22 |
| Sales Index | 0.58 | 0.61 | +0.03 |
| Inventory Index | 0.15 | -0.03 | -0.18 |
| Labor Demand Index | -1.32 | -1.49 | -0.17 |
Standardized scores (0 = mean, ±1 = one standard deviation).
Productivity trends reveal the economy's capacity to grow without stoking inflation. In Mexico, productivity in the secondary sector — mining, energy, construction, and especially manufacturing — signals how efficiently output expands relative to inputs. Strong productivity gains mean firms can meet demand without raising prices, easing inflation pressure and supporting sustainable wage growth. Weak productivity, by contrast, constrains supply, making cost shocks more inflationary. Manufacturing deserves closer scrutiny, as its diverse subsectors respond differently to global demand, exchange rate shifts, and investment cycles. Tracking these patterns helps judge whether growth is supported by efficiency gains or reliant on credit and labor cost increases.
Four composite indices — productivity, sales, inventory, and labor demand — are constructed using Principal Component Analysis (PCA) applied to INEGI manufacturing subsector data and GDP sector composition. PCA extracts the dominant co-movement pattern across subsectors, producing standardized indices that summarize broad trends while filtering out subsector-specific noise. The productivity index draws on output-per-worker measures across manufacturing branches; the sales, inventory, and labor demand indices use INEGI's corresponding survey-based indicators supplemented by GDP sector weights.
Updated: 2026-07-03 by Alexander Dentler
The June 2026 consumer confidence survey shows the general index at 1.12, reflecting elevated sentiment at the 85th percentile. INEGI's latest June 2026 release reveals confidence at 1.12, reflecting elevated sentiment at the 85th percentile. This index rose by 0.11 compared to May, indicating a positive shift in consumer attitudes. However, the durable goods index at 1.72 suggests particularly strong confidence in this area, contrasting with the housing-specific index, which has dropped to 0.10. This divergence may reflect consumers' prioritization of immediate purchases over long-term investments amid ongoing economic uncertainties.
PCA Confidence Indices
| Index | May 2026 | Jun 2026 | Δ |
|---|---|---|---|
| General Sentiment | 1.01 | 1.12 | +0.11 |
| Housing Appetite | 0.34 | 0.10 | -0.24 |
| Durables Appetite | 1.29 | 1.72 | +0.43 |
Values are z-scores (0 = historical mean, ±1 = one standard deviation).
The ENCO (Encuesta Nacional sobre Confianza del Consumidor) is conducted jointly by INEGI and Banco de México. Roughly 2,300 households across 32 major cities are interviewed during the first 20 days of each reference month, and results are published around the 5th of the following month. The survey uses a rotating panel design — each household stays in sample for four consecutive months, rests for eight, then returns for four more — which smooths out idiosyncratic response noise while capturing genuine shifts in sentiment. Because confidence data arrive before most hard activity indicators for the same month, they provide an early read on whether household demand is strengthening or cooling.
Three composite confidence indices — general sentiment, housing appetite, and durables appetite — are extracted from the eight raw INEGI survey questions using Principal Component Analysis (PCA). PCA identifies the common variation within each question group, producing a single index that captures the dominant signal while filtering out question-specific noise. The general index draws on six broad economic outlook questions; the housing and durables indices each isolate spending appetite in categories most sensitive to interest rates and household balance sheets.
Updated: 2026-08-01 by Ignacio Crane
Key Takeaways
News-based policy uncertainty in July 2026 stands at 18.34% of articles tagged policy-uncertain. Mexican news coverage of policy uncertainty reveals a significant level, with 18.34% of articles reflecting this theme, marking a decline from the previous three-month average of 20.0%. Over the past year, however, this metric has risen by 2.9%, indicating a persistent elevation in concerns surrounding economic policy. The most recent month shows a modest decline of 1.7%, suggesting a slight easing in the immediate perception of uncertainty.
By category, the latest data indicates that trade policy is the most significant driver of recent uncertainty. Within the uncertainty narrative, trade policy has emerged as the single largest mover over the last three months, increasing by 2.1 percentage points to 9.43%. Additionally, the labor market and regulation categories have also contributed to the composition of uncertainty coverage, albeit to a lesser extent. This highlights a growing concern among stakeholders regarding the implications of trade dynamics on economic stability.
Compared with the officially published BBD index, the news-derived measure shows a similar downward trajectory. Against the Baker-Bloom-Davis benchmark, which reported a reading of 149.8 for June 2026, both indices reflect a notable decline in policy uncertainty over the past three months. The alignment of these measures reinforces the narrative that while concerns persist, there is a trend towards reduced uncertainty in the short term. This convergence may provide policymakers with a more favorable context for decision-making in the coming months.
The Economic Policy Uncertainty (EPU) index tracks the share of Mexican news articles whose text matches terms spanning three categories — the economy, uncertainty, and policy — scraped daily from five major outlets since 2015 and aggregated into daily, weekly, and monthly indices across 15 policy categories (monetary, fiscal, trade, regulation, and more). This news-derived measure is compared against the externally-published Baker-Bloom-Davis (BBD) Mexico EPU index (policyuncertainty.com), the original academic methodology on which this approach is based. Because uncertainty coverage often front-runs formal policy announcements, the index provides an early, text-based signal of shifting attention toward economic policy risk.
Updated: 2026-07-02 by Alexander Dentler
Key Takeaways
The June 2026 SPF survey reveals a modest decline in economic concerns. The June 2026 SPF survey shows the aggregate Concern Index at 2.83, placing it around the 63rd percentile. This marks a decrease of -0.13 from the previous month, suggesting a slight easing in overall economic anxieties. Nonetheless, the index has experienced a downward trend over the past two months, indicating persistent underlying concerns among economic observers.
The latest survey highlights significant constraints on growth, particularly in public security and trade policy. Economists have identified public insecurity as the top constraint, currently accounting for 9.2% of concerns, followed closely by US trade policy at 8.2%. Notably, public insecurity has decreased by -0.46 from the previous month, while US trade policy has seen a substantial increase of +1.80, underscoring its growing impact on economic sentiment.
Recession concerns remain moderate, reflecting a cautious outlook among economists. The perceived probability of recession stands at 10.0%, which is moderate compared to historical norms. This indicates a stable sentiment among surveyed economists when juxtaposed with the previous quarter, suggesting that while fears exist, they are not at alarming levels. The outlook for the next quarter is slightly more pronounced at 15.0%, indicating a potential uptick in recession fears.
Expectations regarding the peso's valuation indicate a prevailing sense of overvaluation among forecasters. According to forecasters, the current FX forecast misalignment reflects a perceived overvaluation of the peso, with a deviation of +0.058. This sentiment is consistent across multiple horizons, as forecasters anticipate a similar pattern in the following months, suggesting a sustained outlook of a weaker peso than expected.
Banxico's Survey of Professional Forecasters (Encuesta sobre las Expectativas de los Especialistas en Economía del Sector Privado) polls roughly 40 groups of analysts from banks, financial institutions, consultancies, and research centers. Responses are collected during the second half of each reference month — typically between the 15th and 28th — and results are published on the first business day of the following month. Because respondents form their expectations before some end-of-month official data releases, the survey provides an early window into shifting professional sentiment on inflation, growth constraints, recession risk, and exchange rates, making it a valuable leading indicator for policymakers and market participants.
Updated: 2026-08-01 by Ignacio Crane

Key Takeaways
As of 2026-08-01, bond prices reveal the 10Y-3Y spread at 1.30%, reflecting a modest adjustment as the nominal spread decreased by 0.06% from the prior observation. The latest yield curve data shows the 10Y-3Y nominal spread at 1.30%, while the real spread stands at 0.67%. Both spreads remain in normal territory, with the nominal spread indicating a slight decline, suggesting that investors are recalibrating their inflation expectations. The implied inflation spread, currently at 0.64%, reflects market sentiment anticipating subdued inflationary pressures, aligning with the recent easing of headline inflation metrics.
The curve shape suggests alignment with market expectations for a potential interest rate cut from Banxico in the near term. Markets appear to be pricing in a 55% likelihood of a 19 basis point reduction at the next policy meeting, which aligns with the recent adjustments in yield spreads. However, the committee's neutral stance, as underscored in the latest meeting minutes, raises questions about the extent to which these market signals correspond with the Bank's cautious approach to maintaining price stability amid external risks.
Yield Spread Update
| Spread (10Y−3Y) | 30 Jul | 31 Jul 2026 | Δ | NS-DFM |
|---|---|---|---|---|
| Nominal | 1.34 | 1.30 | -0.043 | 0.63 |
| Real | 0.65 | 0.67 | +0.012 | 0.35 |
| Inflation | 0.69 | 0.64 | -0.055 | 0.28 |
All values in percentage points. NS-DFM = Nelson-Siegel Dynamic Factor Model filtered estimate.
When investors and businesses trust that monetary policy will remain credible and predictable, long-term interest rates respond more smoothly to central bank signals. Yield curve spreads between long and short maturities serve as a real-time gauge of this alignment: a stable, upward-sloping curve suggests markets expect gradual normalization, while persistent inversions often signal that markets anticipate policy shifts before they are announced. For Mexico, where inflation targeting depends on anchoring expectations across a diverse investor base, the 10-year minus 3-year spread offers a compact summary of whether policy communication is landing as intended.
Yield curve spreads are filtered using a Nelson-Siegel Dynamic Factor Model (NS-DFM) estimated on weekly data. The model ingests 16 synthetic yield curve points — 11 nominal maturities (overnight through 30 years) and 5 real maturities (overnight through 30 years) — fitted via Nelder-Mead optimization on Banxico bond prices. Factor loadings follow the Diebold-Li (2006) Nelson-Siegel parameterization, decomposing each yield curve into level, slope, and curvature components for both real rates and implied inflation. The Kalman smoother extracts filtered spread estimates that track the underlying signal in daily bond market noise.
Updated: 2026-08-01 by Ignacio Crane

Key Takeaways
Mexican equity markets as of August 1, 2026, show excess returns at -0.0811, reflecting a modest deceleration in market performance amidst ongoing uncertainties. With data through August 1, 2026, realized volatility has registered at 0.0095, indicating a slight decrease in market fluctuations. Notably, the illiquidity index has also shifted somewhat, with the Amihud measure now at 108.96, albeit without a significant material change that would warrant deeper concern. The latest observations suggest a market environment characterized by relatively muted volatility, though historical comparisons indicate that recent indices remain below levels seen earlier this year, highlighting a continued cautious sentiment among investors.
Recent volatility has been driven by a combination of external policy shocks and domestic investor sentiment. The decomposition shows that U.S. policy shocks and liquidity constraints have emerged as the predominant contributors to recent fluctuations, while real-sector difficulties have also played a role in shaping market dynamics. Moreover, the reversal in liquidity conditions reflects an environment where investor confidence is being tested by both domestic and international economic developments. These factors underscore the delicate balance that market participants must navigate amidst competing influences.
Investor sentiment remains tepid, reflecting broader economic uncertainties that are complicating decision-making processes. Policy uncertainty is accentuated, with a notable focus on the interplay between public security and economic policy, which has dominated recent discourse among market participants. The American Association of Individual Investors (AAII) sentiment index and the National Association of Active Investment Managers (NAAIM) exposure indices underscore this cautious outlook, as investors grapple with the implications of potential interest rate adjustments by Banxico amidst a backdrop of heightened external risks. This environment of uncertainty serves as a critical backdrop to upcoming policy decisions.
Volatility Measures
| Measure | Jun 2026 | Jul 2026 | Δ | Top Driver |
|---|---|---|---|---|
| Excess Return | -0.1336 | -0.0269 | +0.1067 | Liquidity and Financing (-0.052) |
| Realized Volatility | 0.0094 | 0.0083 | -0.0012 | Liquidity and Financing (+0.000) |
| Illiquidity (Amihud) | 99.0727 | 99.8026 | +0.7299 | Real-Sector Difficulties (-17.067) |
Monthly averages. Top Driver = largest OLS category contribution to latest value.
Financial market returns, volatility, and liquidity signal investor sentiment and risk appetite. Excess returns over government bonds capture the risk premium investors demand for holding equities; wider spreads suggest higher perceived risk or stronger growth prospects. Realized volatility in a stock market index reflects uncertainty — sharp swings indicate fragile sentiment and raise the cost of capital. Illiquidity shows how trading volume and price impact interact: when liquidity dries up, small trades can move prices disproportionately, amplifying shocks. For monetary policy, these indicators matter because they shape funding costs, investment flows, and the broader transmission of rate decisions into financial conditions.
Volatility drivers are analyzed in two steps. First, Principal Component Analysis (PCA) groups the six SPF concern categories and investor sentiment indicators (AAII bull-bear spread, NAAIM exposure index) into thematic driver clusters that capture common variation. Second, an OLS regression decomposes recent volatility movements into contributions from each driver cluster, quantifying how much of the observed excess return and realized volatility is attributable to policy uncertainty, external sentiment, and domestic macro conditions. The decomposition is descriptive — it identifies contemporaneous associations, not causal effects.
Updated: 2026-08-01 by Ignacio Crane

Key Takeaways
Banxico's August 2026 credit release shows money market spreads at notably low levels, reflecting ongoing easing in financial conditions. Following the latest lending data, rate premia remain constrained, with the ON TIIE funding rate at 0.01% and a TIIE 28-day rate of 0.25%. The spread has tightened by 0.0531% since the previous month, suggesting a continuing trend of narrowing spreads that could facilitate borrowing. This environment of reduced rate premia may encourage lending activity, albeit against a backdrop of economic policy uncertainty.
Household mortgage rates continue to reflect a competitive lending environment, albeit with implications for affordability. The total annual cost of mortgages (CAT) averages 13.8%, with a range from a minimum of 10.7% to a maximum of 28.2%. This modest increase in average costs, in conjunction with the prevailing policy rate, indicates a pass-through effect that may challenge affordability for some borrowers, particularly in the context of broader economic conditions.
Debt issuance patterns show a significant reliance on fixed-rate financing, highlighting shifts in corporate funding strategies. The composition of corporate debt issuance indicates that fixed-rate instruments constitute 19.47% of total financing, while variable rates account for 19.82%. This preference for fixed rates suggests a strategic move by firms to mitigate interest rate risk amid ongoing volatility in economic policies and external factors. Such a shift may reflect a cautious approach to financing in uncertain times.
Rate premia show how market and bank funding costs move relative to the policy rate, indicating the efficiency of monetary transmission. Household mortgage rates capture the cost of long-term borrowing — their sharp rise in recent years signals affordability pressures and distributional effects, as many families face double-digit costs. Debt issuance patterns, normalized by GDP, reveal how firms finance themselves; the balance between fixed and variable rates matters for vulnerability to policy shifts. Together, these indicators show how policy rates filter into real borrowing conditions, affecting credit demand, investment, and ultimately growth and inflation dynamics.